Year
2024
Direction
Angelique Dos Santos
Team
Angelique Dos Santos (Product Design)
Damien Bigot (Product Design)
Cesar Parisot (Product Design)

About E-Volt

Problem statement
Of EV owners already use renewable energy, while 35% are interested in transitioning.
Of EV owners struggle to schedule charging during off-peak or low-cost hours.
Of EV owners are looking to reduce their carbon footprint.
Method & Goals
An online survey was conducted to understand the needs and challenges of EV owners at different stages of their sustainability journey. The goal was to explore how users manage charging, their access to renewable energy, and expectations from an EV charging app.


01/ Need for Simplicity
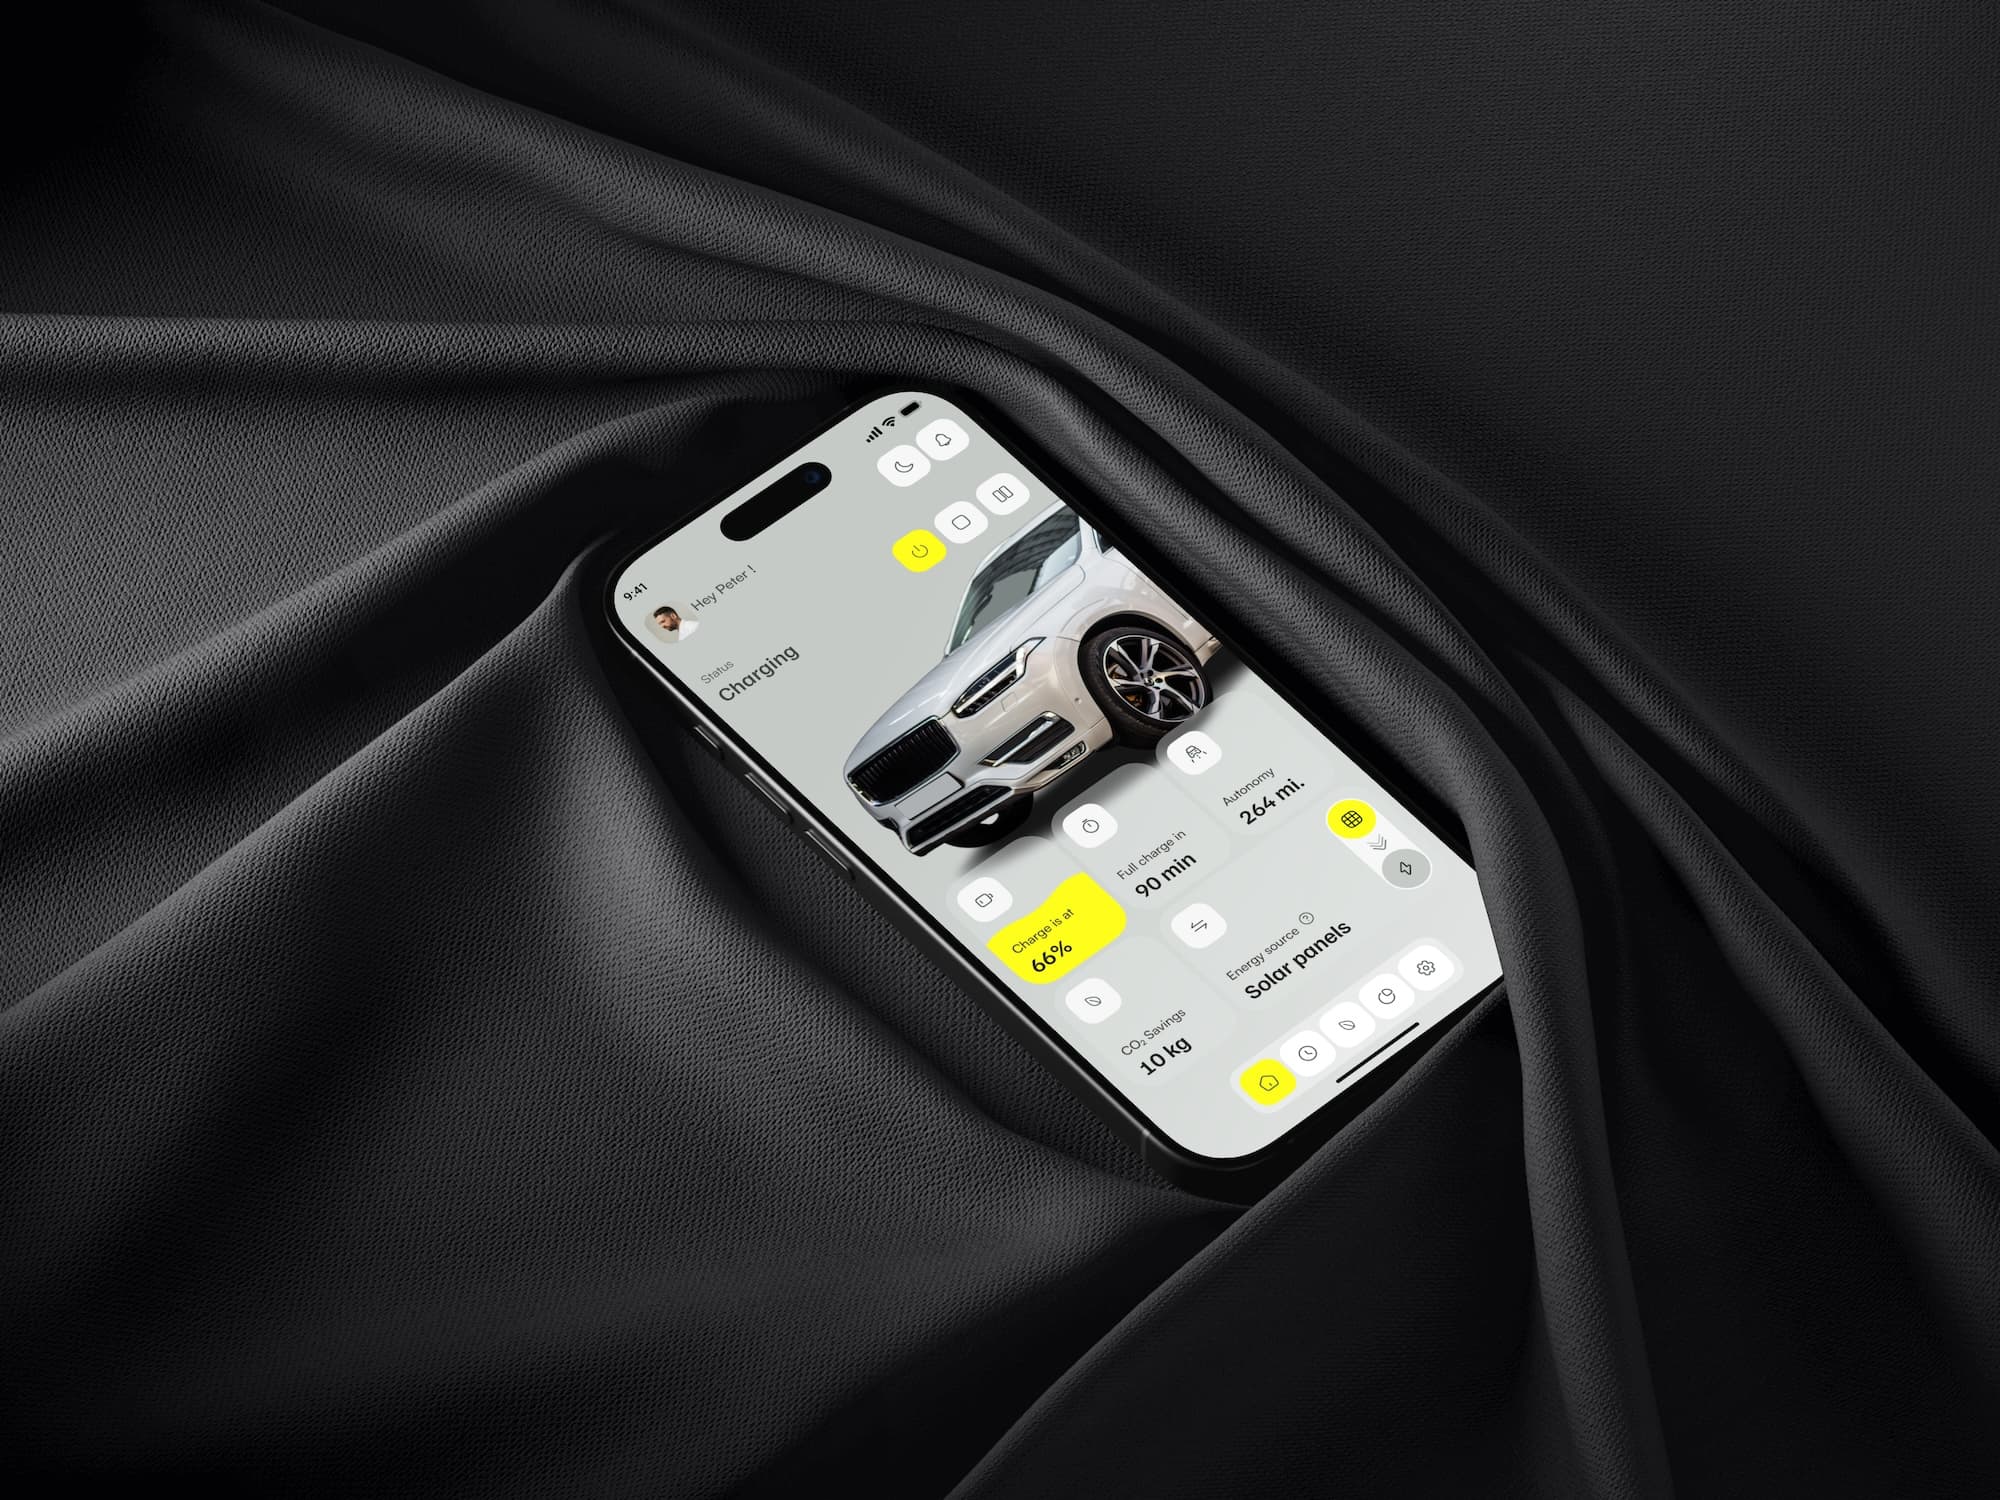
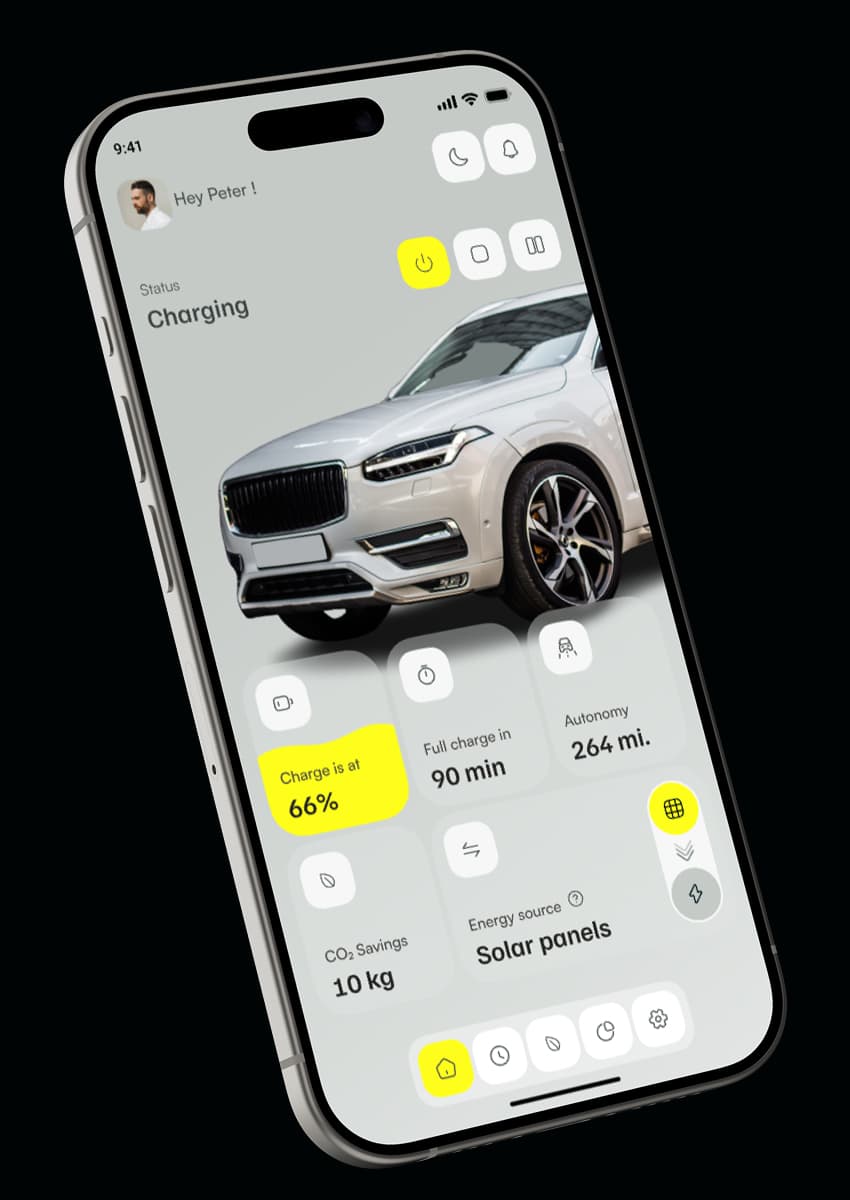
The home screen provides clear charging feedback, helping users make quick decisions about their EV status and range.
Charging stats and driving range simplify trip planning, giving users confidence in their EV’s readiness.
CO₂ savings and energy sources showcase the impact of renewable energy, motivating eco-friendly behavior and reinforcing sustainability.
The welcoming message and user-friendly layout create a sense of personalization and ease, aligning with the user’s desire for intuitive technology.

02/ Actionable Insights
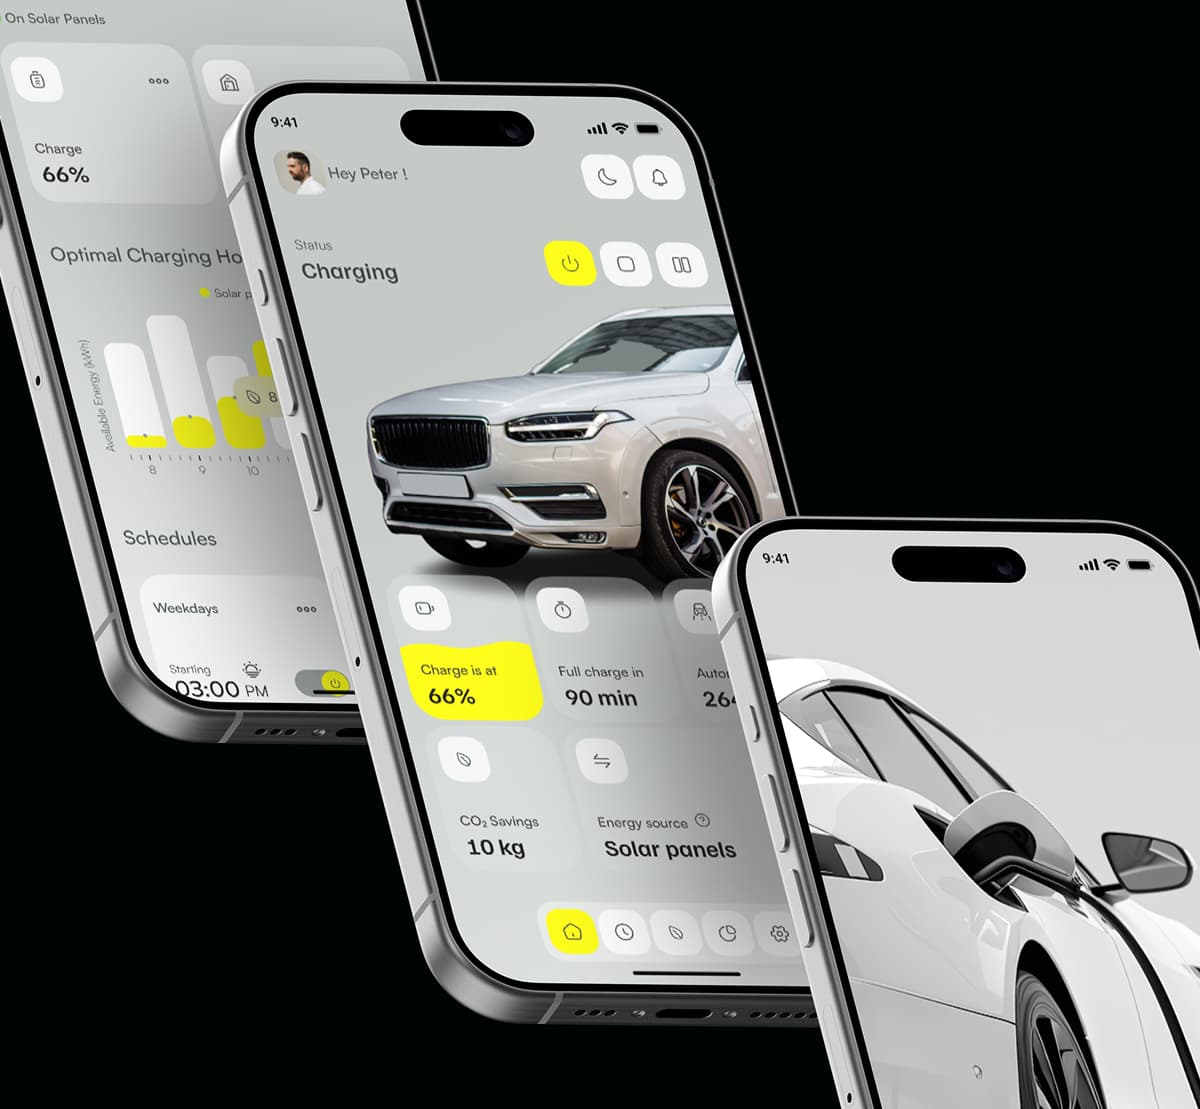
To support their goal of efficient energy use, the Smart Scheduling screen offers personalized scheduling options, helping them optimize charging times based on solar availability. This directly addresses their desire to minimize grid reliance and maximize cost savings.
Displays the active energy source, reinforcing renewable energy use with real-time feedback.
Highlights optimal charging times, helping users prioritize solar energy over the grid.
Allows users to schedule charging efficiently, minimizing grid use and maximizing renewable energy.
03/ Renewable Energy Awareness
User’s reliance on solar panels inspired the Solar vs. Grid Contribution Chart and CO₂ Impact Tracking. These features empower them to see the tangible benefits of his renewable energy use, reinforcing their eco-friendly habits and motivating continued engagement.
Users can see their CO₂ savings in real-time, providing tangible evidence of their environmental impact.
The forward-looking statement encourages users to stay consistent in their sustainable practices by tracking progress toward monthly goals.
The "Solar vs. Grid Contribution" chart enables users to understand their charging energy sources, and adjust habits as needed.

